Who was a better shot blocker in 2019 - Tacko Fall or Tariq Owens?
If you look at total blocks, then you might say Tariq was better (85 vs. 92). However, if you instead looked at BPG (2.6 vs. 2.4) or BLK/40 (4.1 vs. 3.8), then you might say Tacko was better.
As an advanced stat geek you know those numbers have caveats and you will likely check out block percentage instead. After visiting your favorite NCAA stats site will see that Tacko had a BLK% of 11.5% compared to 12.1% for Tariq. At this point you can now authoritatively declare Tariq Owens as the better shot blocker in 2019!
But wait...I'm now here to tell you that there is a bit more to this story...
It turns out that many NCAA and NBA advanced stats are actually estimates and not true calculations.
How to calculate "actual" advanced stats?
The grueling process of converting play-by-play data into "stint data" is hugely valuable. Beyond enabling RAPM to be calculated, this data can also be used to authoritatively calculate common advanced stats (i.e. ORB%, BLK%, AST%) instead of relying on estimates.
Having already done the hard part, I thought it would be interesting to compare how close the estimated versions of these metrics align with actual calculations.
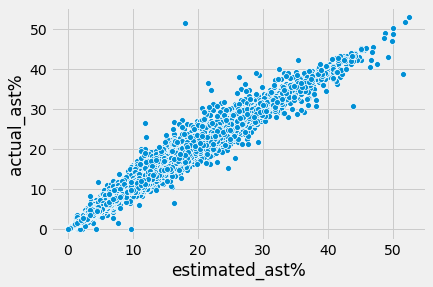
How much do "estimated" advanced stats differ?
Generally speaking, the estimated versions of these statistics align quite closely with the actual measurements1. As you can see below, the correlation between estimated and actual is > 0.98 across all metrics2.
| Stat | Correlation |
|---|---|
| AST% | 0.992 |
| BLK% | 0.996 |
| DRB% | 0.982 |
| ORB% | 0.995 |
| STL% | 0.995 |
| USG% | 0.992 |
When do "estimated" statistics differ from "actual"?
After digging into discrepancies, a handful of common patterns showed up. Before sharing these insights, let me first refresh your memory on the definitions for these advanced stats.
| Stat | Definition |
|---|---|
| AST% | 100 * AST / (((MP / (Tm MP / 5)) * Tm FG) - FG) |
| BLK% | 100 * (BLK * (Tm MP / 5)) / (MP * (Opp FGA - Opp 3PA)) |
| DRB% | 100 * (DRB * (Tm MP / 5)) / (MP * (Tm DRB + Opp ORB)) |
| ORB% | 100 * (ORB * (Tm MP / 5)) / (MP * (Tm ORB + Opp DRB)) |
| STL% | 100 * (STL * (Tm MP / 5)) / (MP * Opp Poss) |
| USG% | 100 * ((FGA + 0.44 * FTA + TOV) * (Tm MP / 5)) / (MP * (Tm FGA + 0.44 * Tm FTA + Tm TOV)) |
1. Individual players impact team pace
As you can see above, the denominator of these metrics all include overall team statistics weighted by the portion of minutes a player played. This assumes that team statistics are distributed evenly over time, which isn't always the case.
Bench players are often asked to milk the clock in a blowout. The coach might ask a specific player to push the pace. When a talented big man enters the game, the offense may slow down and work the ball inside.
An individual player can impact the pace on the defensive side as well. Dynamic defenders can speed up the game with turnovers and fast break points. On the other hand, a top tier defender or shot blocker can slow the game down by making it more difficult on the offense to find a good shot. It turns out that Tacko is one of those players!
Using stint data, I was able to calculate the average length of possession for all possessions that a player was on the court for. Below shows possession stats for the 2019 UCF Knights (sorted by minutes played):
| Player | Off Poss (sec) | Def Poss (sec) | Off Pace | Def Pace |
|---|---|---|---|---|
| B.J. Taylor | 18.1 | 18.1 | 66.3 | 66.3 |
| Aubrey Dawkins | 18.1 | 18.1 | 66.3 | 66.3 |
| Terrell Allen | 18.2 | 18.2 | 65.9 | 65.9 |
| Tacko Fall | 18.7 | 18.8 | 64.2 | 63.8 |
| Collin Smith | 18.3 | 18.3 | 65.6 | 65.6 |
| Chad Brown | 18.0 | 17.9 | 66.7 | 67.0 |
| Dayon Griffin | 17.6 | 18.0 | 68.2 | 66.7 |
| Frank Bertz | 17.5 | 17.4 | 68.6 | 69.0 |
| Ceasar DeJesus | 17.5 | 17.5 | 68.6 | 68.6 |
As you can see, when Tacko was in the game the UCF pace slowed greatly on both ends of the court. This means that advanced stats that rely on possession estimates (based on minutes played) will credit Tacko for being on the court for more possessions than he actually was. This in turn will artificially lower statistics like BLK%, since shot block opportunities will be overstated.
2. Individual players change team dynamics
Beyond just pace, individual players can have a large impact on team strategy and style of play. As you can see below, Tacko also has a huge impact on the opposing team's ability to take and make shots inside the three-point line.
| Player | Opp 2PA/FGA | Opp FG% |
|---|---|---|
| B.J. Taylor | 60.8% | 39.8% |
| Aubrey Dawkins | 62.3% | 39.4% |
| Terrell Allen | 62.3% | 38.7% |
| Tacko Fall | 58.6% | 37.5% |
| Collin Smith | 62.9% | 40.2% |
| Chad Brown | 62.8% | 39.1% |
| Dayon Griffin | 63.3% | 40.0% |
| Frank Bertz | 60.4% | 41.2% |
| Ceasar DeJesus | 62.5% | 43.7% |
With opponents having a lower proportion of 2PA with Tacko on the court, it is incorrect to distribute UCF's total opponent 2PA evenly by minutes played. This credits Tacko for a higher number of opponents 2PA than actuality, which will artificially lower his BLK%. Not all players will have as large of an impact on the game as Tacko, but any shift in team dynamics can result in unrealized biases in estimated advanced stats.
3. Players with less playing time have less influence on team totals
In the examples above, we can see that statistical totals for a team are not always reflective of team statistics during the time that a player was on the court. This is especially true for bench players who have less playing time. This is also true for players who suffer injuries during the season. A great example of this is Kyrie Irving who played in only 11 out of 37 of games for the 2011 Duke Blue Devils. Kyrie is a high impact player so this is an especially interesting use case to examine. In particular, Kyrie's estimated AST% was noticeably lower than his actual AST%.
With a high usage rate (26.4%), the number of FGM/40 by Kyrie's teammates was much lower when he was on the court (i.e. 24.3 FGM/game when he played vs. 27.6 when he didn't). This is partly due to Kyrie contributing lots of scoring himself (5 FGM/game). With Kyrie missing a large portion of the season, his teammates FGM/40 across the season more closely matched the latter. Kyrie's estimated AST% was impacted by this discrepancy because it is assuming a larger number of assist opportunities (teammate FGM) than he had in reality.
| Kyrie | # Games | Kyrie FGM | Teammate FGM | Team AST% |
|---|---|---|---|---|
| Kyrie Played | 11 | 5.0 | 24.3 | 53.3% |
| Kyrie DNP | 26 | 0.0 | 27.6 | 49.0% |
As hinted at, Kyrie's actual AST% was higher than his estimated AST%:
| Player | AST% (actual) | AST% (estimated) | Diff |
|---|---|---|---|
| Kyrie Irving | 32.4% | 29.8% | 2.6 |
We must remember that overall team statistics may not generalize as well for players with less playing time. Low-minute but high-impact players are ones to be especially mindful of.
4. Efficiency impacts opportunities
More effective defensive players will create more defensive rebound opportunities (i.e. more missed shots). If we look at the 2018 Michigan Wolverines, we can see Jon Teske and Moritz Wagner on different ends of the spectrum. When Teske was on the court, opponents were held to a 37.8%(!) FG%. While on the other hand, opponents shot 45.4% when Wagner was on the court. These differences in efficiency have a non-trivial impact on the number of DRB opportunities. The more-efficient Teske actually has an overstated estimated DRB% because he had more opportunities for defensive rebounds that his estimated numbers would suggest, with the inverse being true for Wagner.
| Player | Opp FG% | DRB% (actual) | DRB% (estimated) | Diff |
|---|---|---|---|---|
| Moritz Wagner | 45.4% | 26.9% | 24.7% | 2.2 |
| Isaiah Livers | 45.1% | 12.4% | 11.4% | 1.0 |
| Zavier Simpson | 44.3% | 13.6% | 12.8% | 0.8 |
| Charles Matthews | 43.3% | 18.1% | 17.0% | 1.1 |
| Muhammad-Ali Abdur-Rahkman | 43.1% | 11.7% | 11.0% | 0.7 |
| Duncan Robinson | 41.3% | 9.0% | 9.2% | -0.2 |
| Jordan Poole | 40.5% | 12.3% | 12.7% | -0.4 |
| Eli Brooks | 39.5% | 9.8% | 9.3% | 0.5 |
| Ibi Watson | 38.3% | 8.3% | 8.9% | -0.6 |
| Jaaron Simmons | 38.0% | 8.4% | 9.1% | -0.7 |
| Jon Teske | 37.8% | 16.6% | 18.6% | -2.0 |
On offense, more efficient offensive players will create less offensive rebound opportunities (i.e. less missed shots). This was apparent for [2010 Kentucky Wildcat](https:// https://www.sports-reference.com/cbb/schools/kentucky/2010.html) starters Patrick Patterson and DeMarcus Cousins. As seen below, Patterson's positive impact on team FG% translates to less ORB opportunities, causing his estimated ORB% to understate his value on the offensive glass.
| Player | Team FG% | ORB% (actual) | ORB% (estimated) | Diff |
|---|---|---|---|---|
| Daniel Orton | 49.4% | 10.6% | 10.3% | 0.3 |
| Patrick Patterson | 49.0% | 11.3% | 10.6% | 0.7 |
| Darius Miller | 48.9% | 5.0% | 4.7% | 0.3 |
| John Wall | 48.7% | 2.7% | 2.7% | 0.0 |
| Eric Bledsoe | 48.5% | 2.0% | 1.9% | 0.1 |
| DeMarcus Cousins | 47.3% | 19.0% | 19.8% | -0.8 |
| Darnell Dodson | 46.8% | 3.4% | 3.6% | -0.2 |
| DeAndre Liggins | 44.9% | 4.6% | 4.6% | -0.0 |
Every player has their own unique impact on offensive and defensive FG%. If there are significant efficiency differences within a team, this can have noticeable impact on rebound opportunities which can throw off rebound percentage estimates.
How much does this matter?
While it is interesting to analyze differences between estimated and actual advanced stats, typically the deltas are small and the estimate advanced stats are "good enough". That is unless you need to authoritatively know whether Tacko or Tariq had a better BLK%.
To help you gauge how much this matters, here are observed differences between estimated and actual advanced stats. To help interpret, this is saying: 98% of the time a player's actual AST% will be between 'estimated AST% - 1.72' and 'estimated AST% + 3.66'.
| Stat (actual vs. estimated) | p1 | p99 |
|---|---|---|
| AST% Difference | -1.72% | 3.66% |
| BLK% Difference | -0.47% | 0.85% |
| DRB% Difference | -2.63% | 2.56% |
| ORB% Difference | -0.91% | 1.40% |
| STL% Difference | -0.16% | 0.35% |
| USG% Difference | -0.99% | 2.50% |
You can be the judge as to whether or not these differences are large enough for you to care but either way it is always good to understand weaknesses of your data!
Oh, and in case you were wondering - contrary to popular belief, it turns out that in 2019 Tacko did have a higher actual BLK%!
| Player | BLK% (actual) | BLK% (estimated) |
|---|---|---|
| Tacko Fall | 12.6% | 11.5% |
| Tariq Owens | 11.7% | 12.1% |
- It is worth pointing out that play-by-play data is messy and not always accurate, which means that "stint data" is imperfect as well. Additionally, determining which players are not on the court is not as easy as it sounds, so it is quite possible there are some edge cases which are not handled correctly. However, the fact that the estimated and actual statistics align so closely gives me confidence that data quality is not a major problem and my logic/heuristics are generally correct. It is also worth mentioning that some small differences are due to me the filtering out "garbage time" possessions (which also happens to be the messiest portions of play-by-play data). This filtering is minimal and mostly impacts low minute bench players.↩
- This data spans 10 seasons (2010-2019) filtering to all players who played >100 minutes in a season.↩